
Linear Kinetics
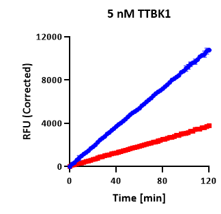
Endpoint and kinetics fully agree.
Two clean straight lines from origin — DMSO rising steeply, compound shallow but linear. This is a straightforward reversible inhibitor, and the only pattern endpoint profiling reliably identifies correctly.
Initial Lag
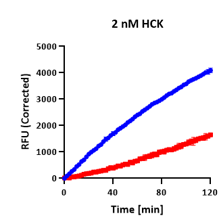
Both curves flat ~20 min before rate establishes.
The enzyme takes time to reach its steady-state activity. Endpoint assays that sample during this lag calculate a falsely low rate, inflating apparent inhibition. Continuous assays identify the true linear window and calculate from there.
TDI Detected
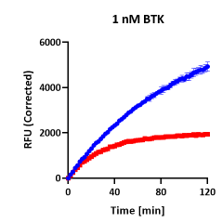
Inhibition deepens over time — slope progressively decelerates.
Both curves start from a shared elevated baseline, then diverge as the compound progressively occupies or modifies the enzyme. A single endpoint measurement captures only a snapshot — and misses the mechanism and its true potency entirely.
Assay Artifact
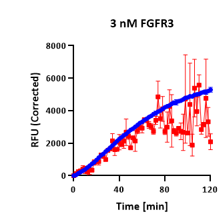
Heavy scatter throughout — noise invisible at endpoint.
The compound curve shows extreme replicate variability. The 61% inhibition read is an artifact with no statistical basis. Endpoint platforms report this with the same confidence as a clean result.
Endpoint and kinetics fully agree.
Two clean straight lines from origin — DMSO rising steeply, compound shallow but linear. This is a straightforward reversible inhibitor, and the only pattern endpoint profiling reliably identifies correctly.
Both curves flat ~20 min before rate establishes.
The enzyme takes time to reach its steady-state activity. Endpoint assays that sample during this lag calculate a falsely low rate, inflating apparent inhibition. Continuous assays identify the true linear window and calculate from there.
Inhibition deepens over time — slope progressively decelerates.
Both curves start from a shared elevated baseline, then diverge as the compound progressively occupies or modifies the enzyme. A single endpoint measurement captures only a snapshot — and misses the mechanism and its true potency entirely.
Heavy scatter throughout — noise invisible at endpoint.
The compound curve shows extreme replicate variability. The 61% inhibition read is an artifact with no statistical basis. Endpoint platforms report this with the same confidence as a clean result.