Kinome Tree Mapping Application
Visualize your kinome profiling data with customizable kinome trees.

Our Kinome Tree Mapping Application is a comprehensive solution for visualizing, exploring, and customizing your kinome profiling results. With this application, you can create your own kinome tree using a wide range of easy-to-use features. To get started, create your free account, upload your data, and generate kinome trees using custom and preset color schemes.
Using our application, you can understand your kinome profiling results in depth, shedding light on your compound’s selectivity and potential off-targets. Its intuitive interface and user-friendly features make it accessible to experts and beginners alike. Sign up for a free account today to unlock the potential of your kinome profiling data and start exploring the possibilities.
Three Simple Steps to Create Personalized Kinome Trees:
01. Upload Your Data
To start, upload your data under Kinase & Percent Inhibition. You can manually add kinases and % inhibitions by selecting "Add New". If you have a ready-made Excel file, select "Import/Choose File" to import it and hit "Submit".
To prepare a file for upload, download our Excel template containing two columns: Column A contains the kinase names using our default naming scheme. Column B lists the percent inhibition for each kinase (without a percentage symbol).
Please note that version 1.0 of this application only recognizes a default kinase naming scheme. If you import data using an alternative naming scheme, you will receive an error message, and any incompatible kinase names will be highlighted in red.
Use our kinase naming table to find the compatible naming scheme.
Want to try the app but haven’t generated profiling data?
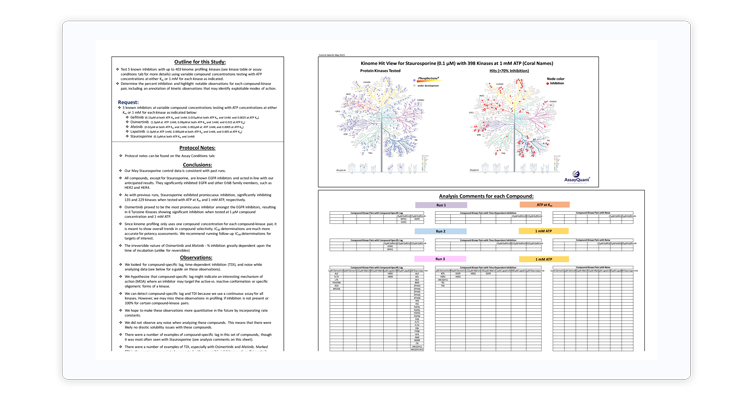
Download an example profiling data set run with Staurosporine (0.1 µM at 1 mM ATP) and build custom kinome trees.
Please note: if AssayQuant generated your profiling report before January 2024, it may need to be converted before uploading it to the application. For reports generated after January 2024, you will find a button to create a table formatted for automatic upload.
02. Choose Visualization Theme
You can select from pre-set binary and heat map color schemes or customize your visualization. Our pre-set binary scheme displays the kinases equal to or greater than 70% red and less than 70% green. The heat map function bins the kinases based on their % inhibition and colors each leaf, similar to a heat map.
The customization option enables you to create bins of your choice based on percent inhibition and select any color to represent that category.
03. Generate Images
To visualize your data, you only need to choose "Generate Image" at the top of the page. You can explore each kinase family by zooming in and out or resetting the image.
When you're happy with your customized kinome tree image, you can download it as a high-resolution JPG or PDF file. This will allow you to include it in your presentations and publications easily.
Discover KinSight™ Quantitative Kinome Profiling Services
Our KinSight™ Quantitative Kinome Profiling Services provide insights into selectivity and mechanism of action for drug discovery research.
Our services use PhosphoSens® technology, a continuous assay format that directly quantifies the enzymatic activity of the target by reporting substrate phosphorylation during the entire reaction, which identifies potential off-targets. This makes it possible to use kinome profiling services at all stages of the pre-clinical drug discovery process.
Stay Informed
Want to hear the latest about our technology? Be among the first to learn about our latest products and services.