Beyond Binding: real-time, activity-based kinome and phosphatome profiling
An endpoint read gives you one number at one time point. See what a progress curve in every well reveals about selectivity, mechanism and assay quality, across the kinome and the phosphatome.
Selectivity data decides which compounds advance. A single read can't tell the whole story.
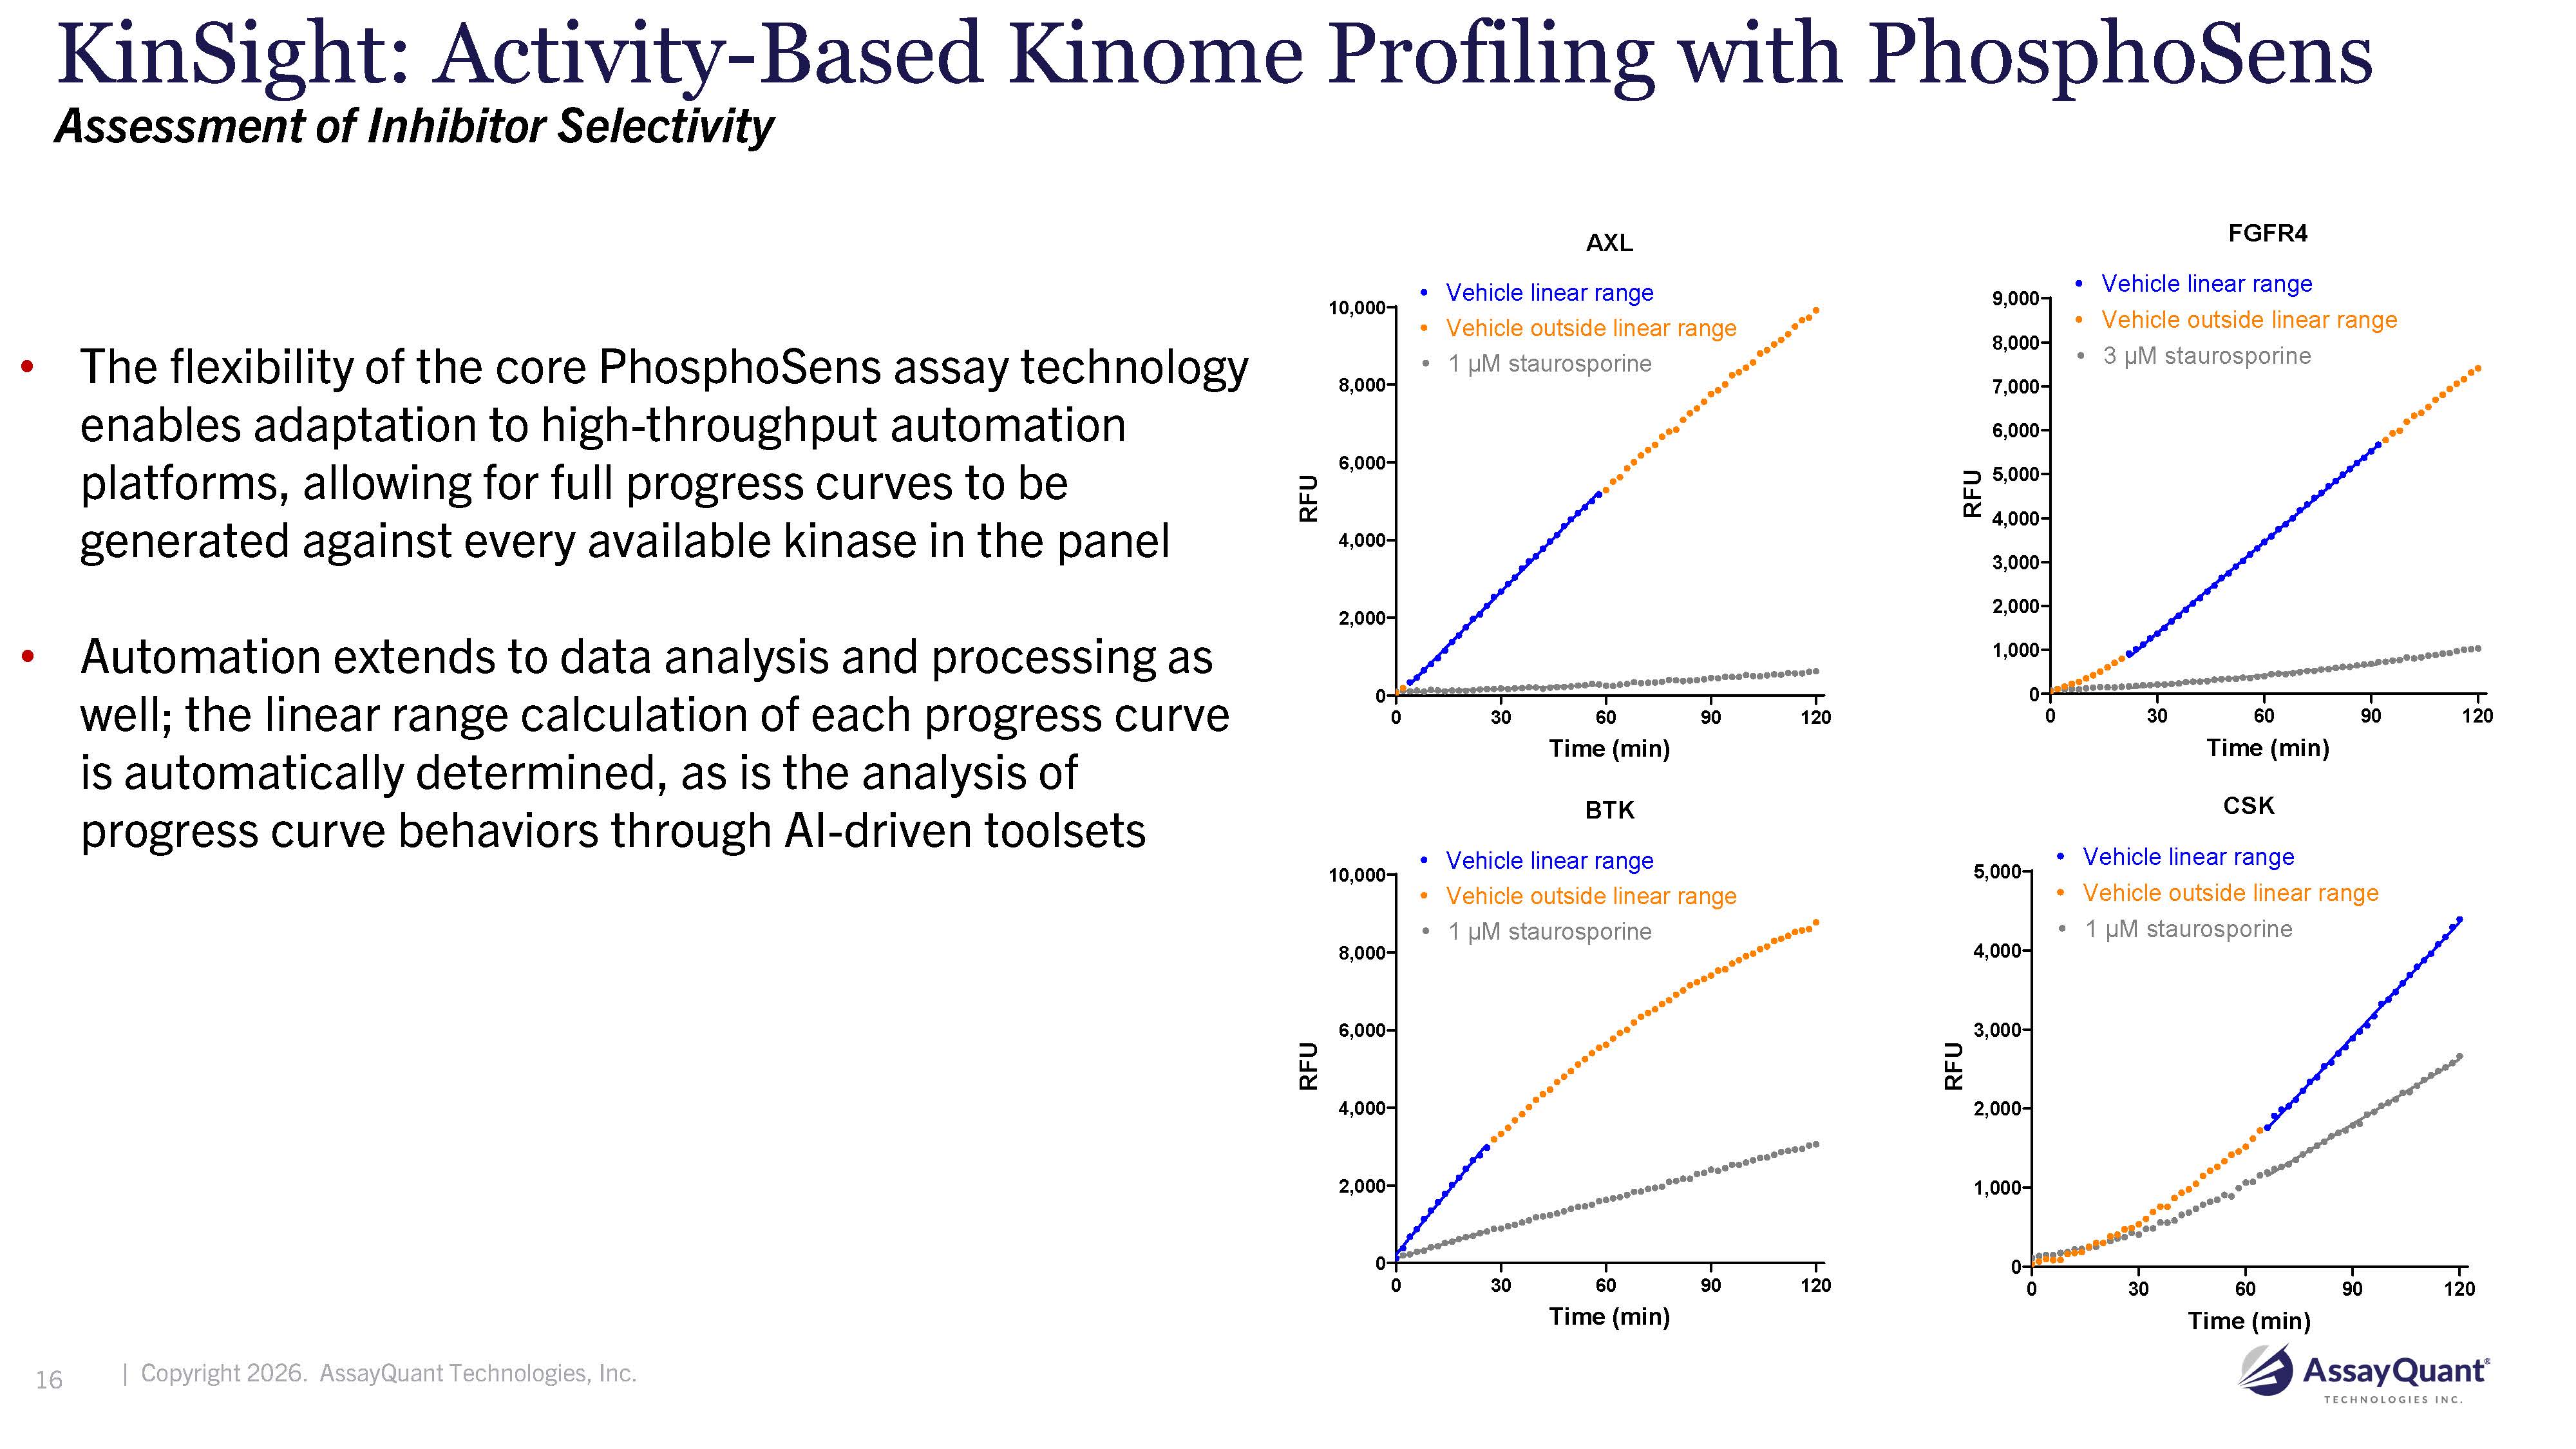
Most panels rely on a binding readout or a single endpoint at low ATP. Binding tells you a compound engages a target, not how well it inhibits it. An endpoint tells you how much product formed, not whether the enzyme behaved as assumed or whether inhibition changed over the course of the assay. Activity-based profiling with continuous progress curves measures inhibition directly and shows you how it unfolds.
Topics covered in this session
Six things you'll take away from the session
One number, four stories
Why the same endpoint % inhibition can hide completely different kinase behavior, and how a progress curve in every well tells them apart.
Catch it in the primary screen
Spot time-dependent inhibition, lag phases and assay artifacts before they derail a candidate.
Binding is not inhibition
Why Kd doesn't translate one-to-one into activity, with a J. Med. Chem. example where hit rank order changed.
1 mM ATP or ATP Km?
How to choose your profiling condition, and what each tells you about selectivity.
Inside a KinSight™ report
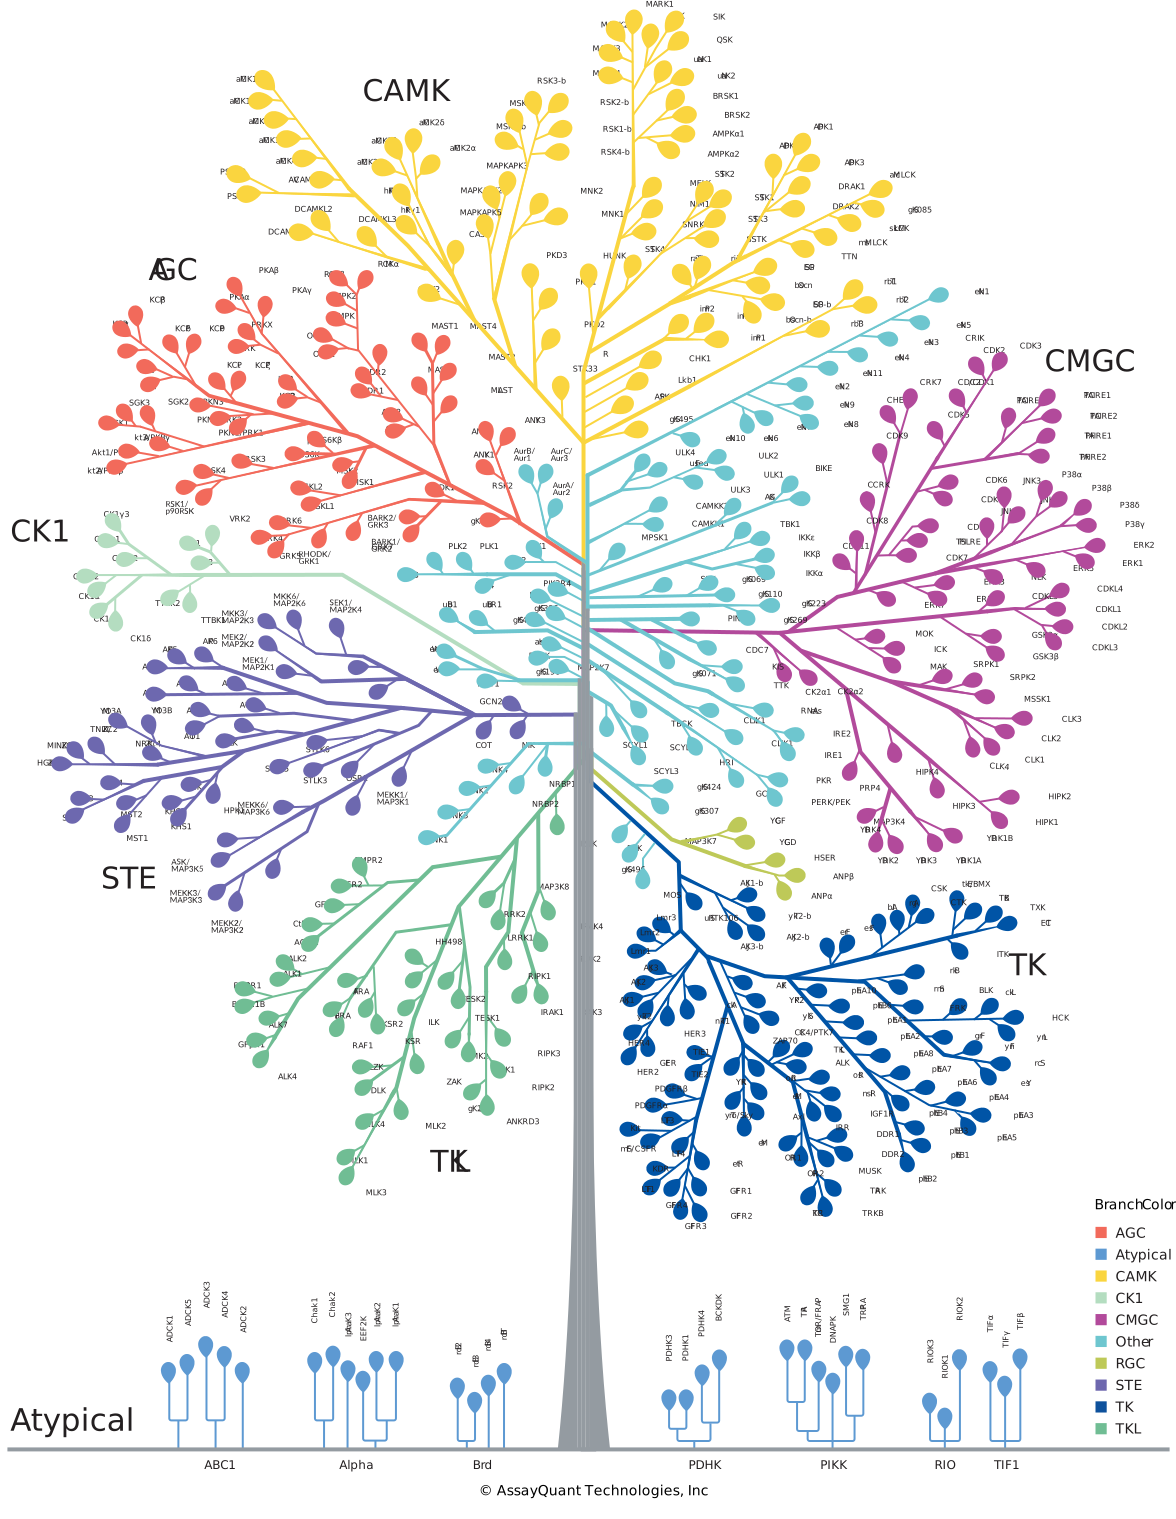
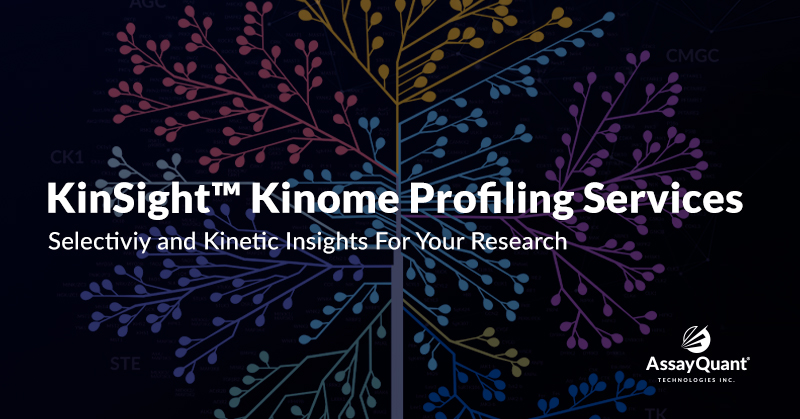
Heat map, waterfall plot, kinome tree, and flagged progress curves for every compound.
Profiling the phosphatome
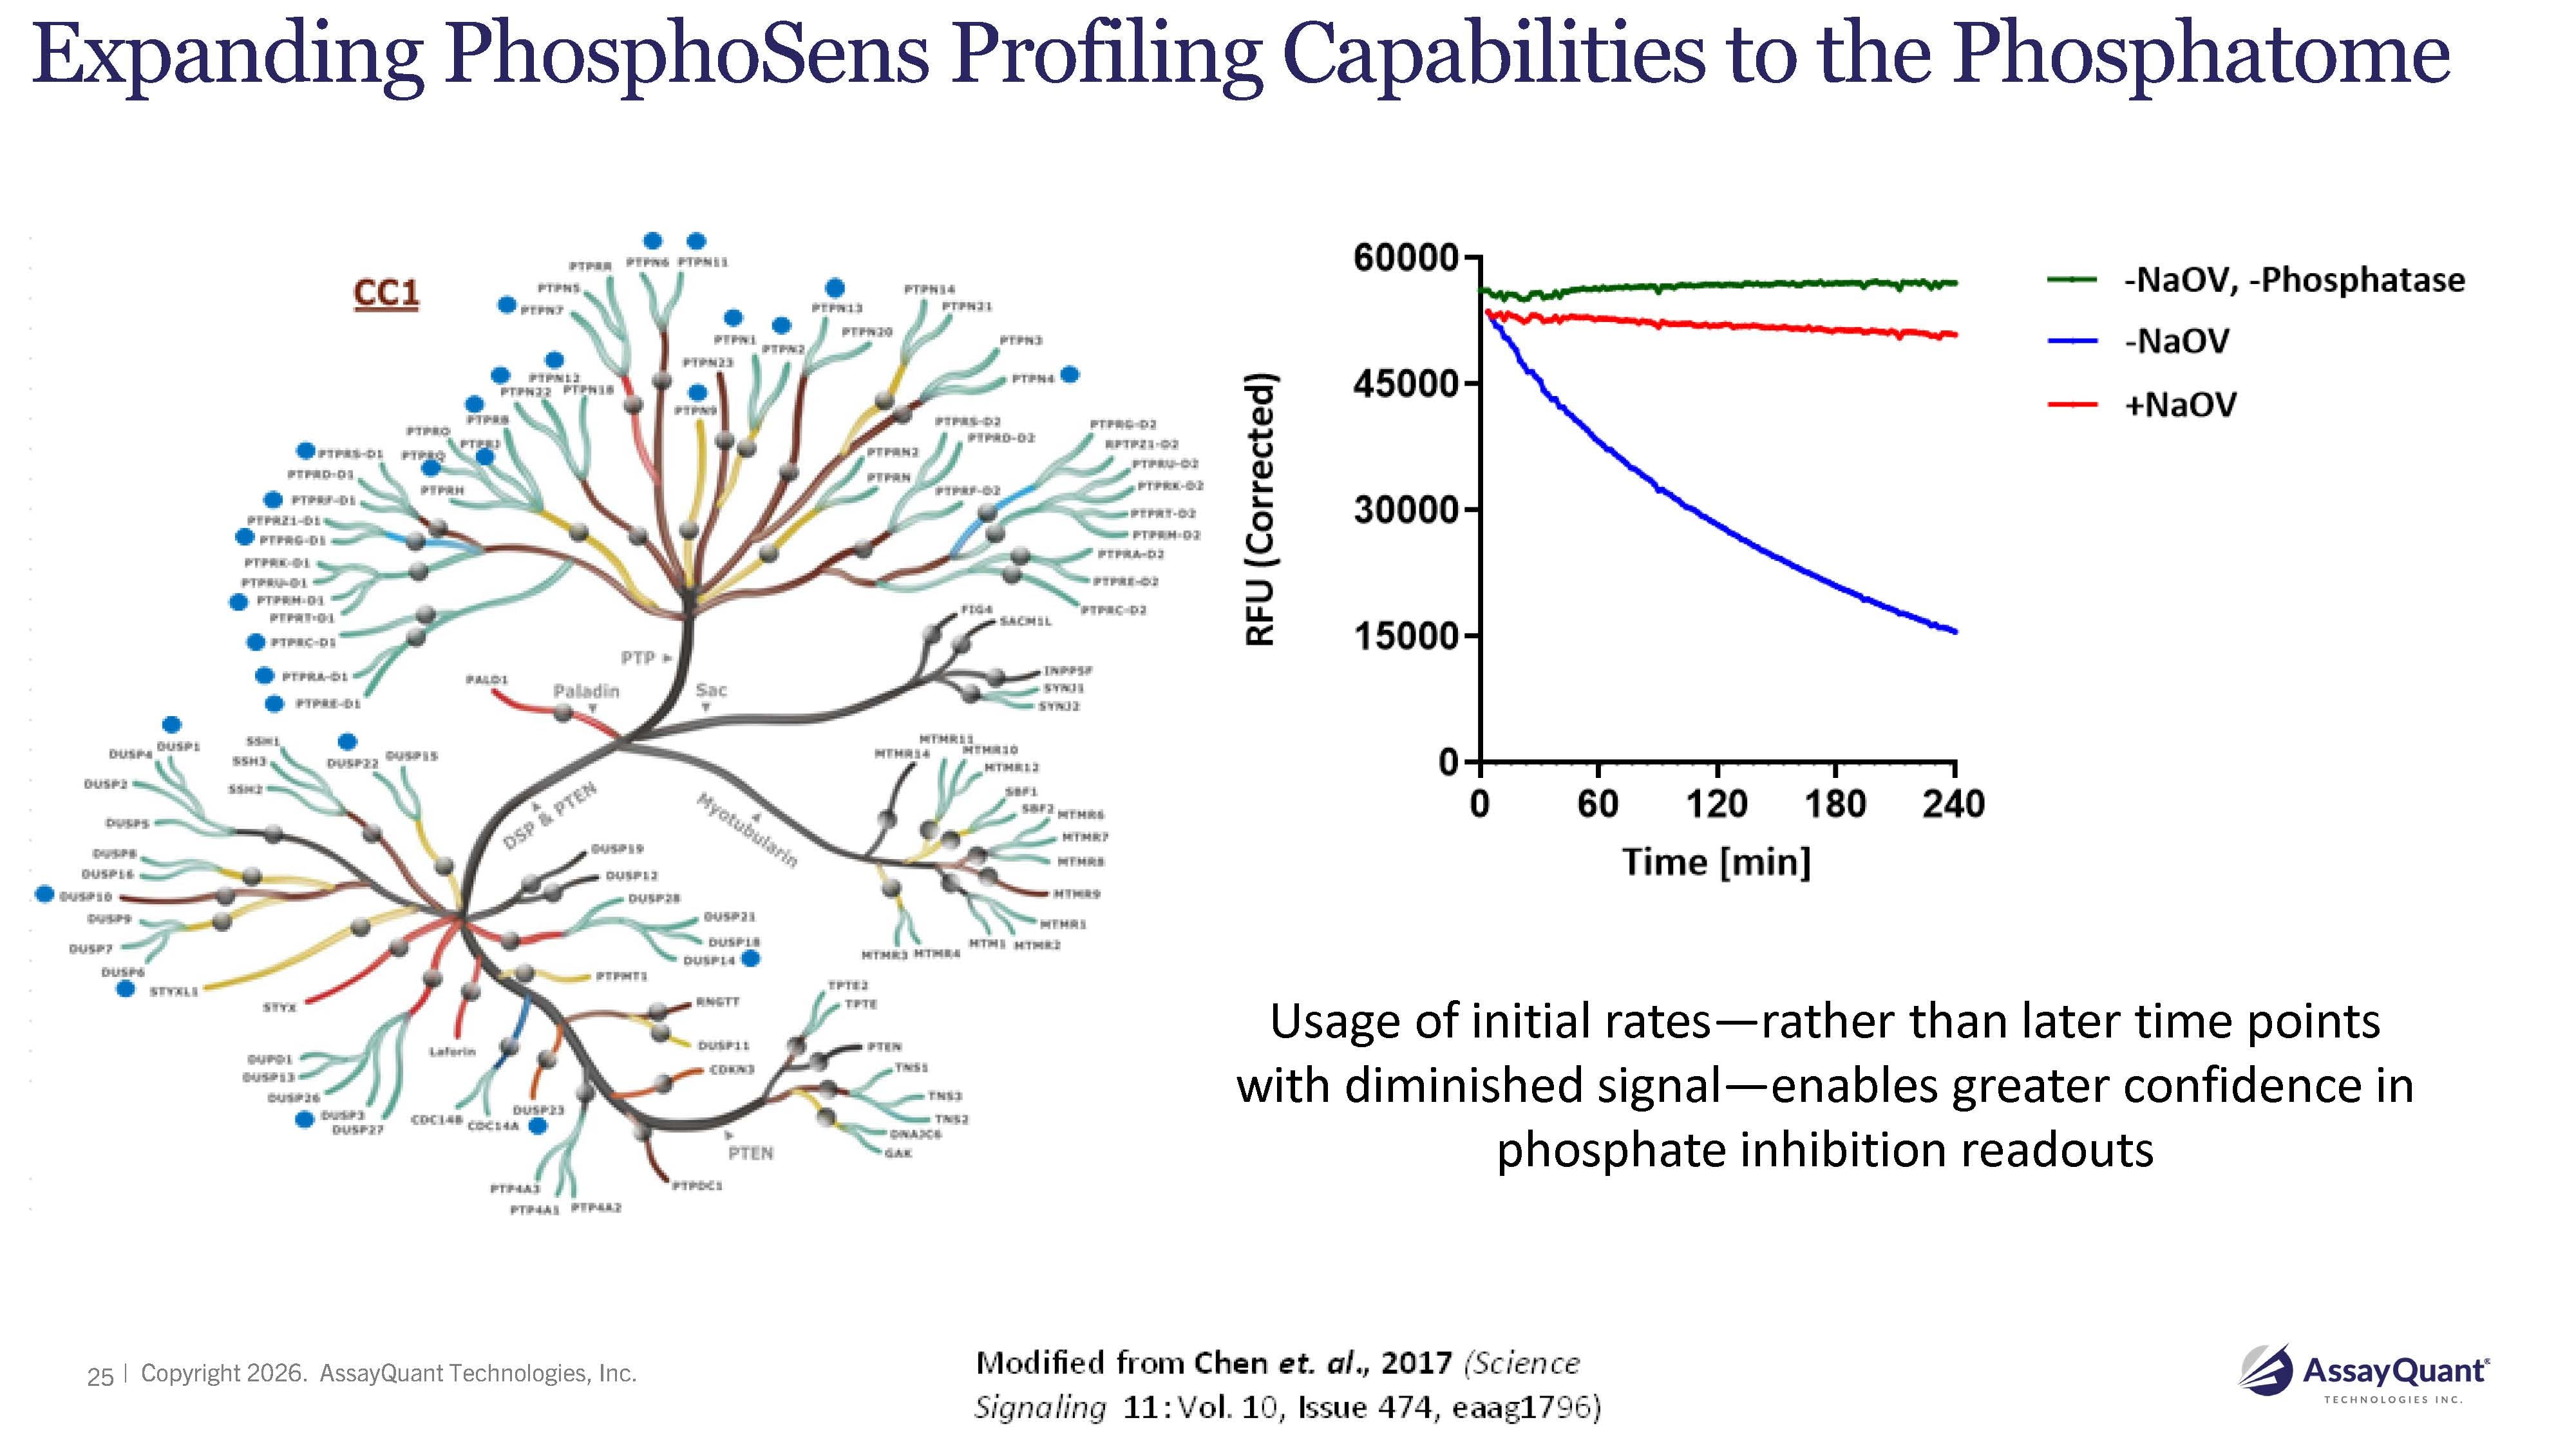
How the same real-time approach extends to 50 protein phosphatases, read by initial rates.
Activity-based profiling across the kinome and the phosphatome
The same PhosphoSens® assays Daniel walks through in the webinar, run as a service by the team that built them.
Wild-type and mutant, on one activity-based PhosphoSens® platform
Protein phosphatase profiling from initial reaction rates, which few providers offer at all
Physiological ATP, ATP Km for the widest off-target view, or both side by side
To a report with heat map, waterfall plot, kinome tree and flagged progress curves
Tell us your targets, series and the decision the data needs to support.
We recommend the panel, ATP condition and controls, and quote it.
Results in 10–15 days, with a straight path to IC50, Ki and kinact/KI.
Put this to work on your own compounds
Send us your targets and series, and we'll recommend a panel, ATP condition and follow-up kinetics.
Working on a covalent or slow-binding inhibitor program?
Get direct scientific support characterizing your compounds — plus access to our Excel-Fit templates for streamlined kinact/KI and residence-time analysis.
One endpoint, four stories
Binding vs. inhibition
Profiling the phosphatome
Daniel Urul, PhD | Senior Scientist, Discovery Technologies
Daniel runs AssayQuant's KinSight™ kinase and phosphatase profiling panels, working directly with pharma and biotech teams to turn selectivity data into mechanism: IC50, Ki, reversibility and time-dependent inhibition.
Get the full session and the slides
Daniel Urul, PhD, the scientist who runs our KinSight™ panels, shows why one endpoint number can hide four different stories, why binding is not the same as inhibition, and how activity-based profiling at 1 mM ATP or ATP Km catches time-dependent inhibition and lag phases in the primary screen. It ends with phosphatome profiling and a live Q&A, including how to choose your ATP condition. Fill in the form for instant access to the 44-minute recording and the slide deck.